Project Overview
The British Airways Performance Dashboard was designed to analyze operational efficiency and business performance using Power BI. It visualizes key metrics such as revenue, passenger count, route performance, and punctuality rates, offering a comprehensive understanding of the airline’s global operations and trends. Through interactive visuals and automated DAX-driven insights, the dashboard simplifies performance tracking and enables faster data-driven decision-making across departments.
Business Impact and Insights
This dashboard enables management to identify high-performing routes, track delays, and forecast demand patterns effectively. By translating complex datasets into actionable insights, it helps British Airways improve decision-making, optimize flight schedules, and enhance overall profitability and customer satisfaction. The solution promotes real-time performance monitoring and highlights key operational inefficiencies. Ultimately, it serves as a strategic tool to strengthen competitiveness and drive sustainable growth in the aviation industry.
.png
)
British Airways Performance Dashboard
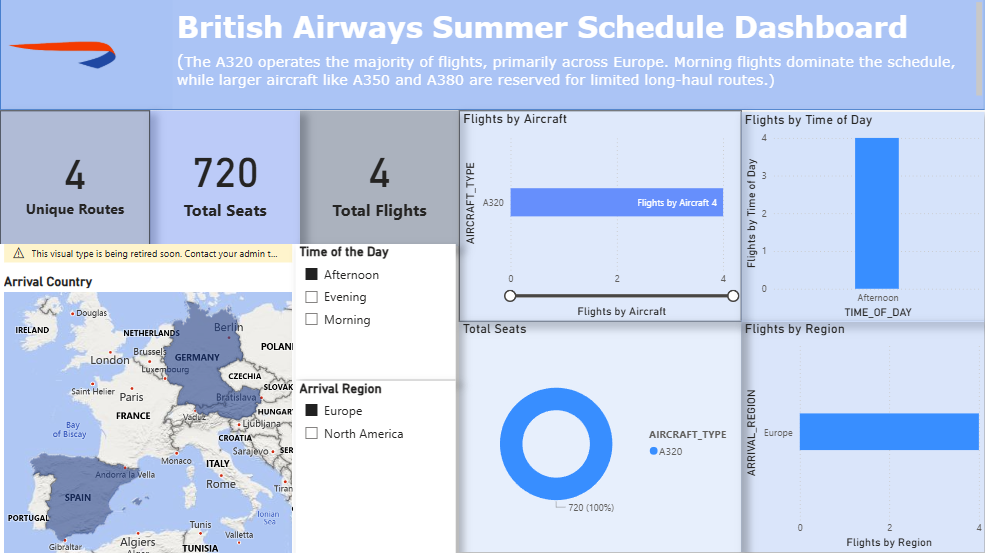
British Airways Performance Dashboard
Key Learnings and Project Outcomes
- Developed a strong understanding of data visualization and storytelling using Power BI, creating dashboards that convey business insights effectively.
- Gained hands-on experience with DAX functions to calculate KPIs such as total revenue, passenger count, and punctuality rates.
- Improved skills in data cleaning and transformation, ensuring accuracy in performance metrics and visuals.
- Strengthened analytical thinking by identifying patterns and anomalies in operational data to optimize airline performance.
- Enhanced decision-making abilities by designing visuals that support management-level insights for route efficiency and profitability.
- Learned to integrate design principles (layout balance, color consistency, typography) for professional dashboard presentation.
- Understood how data-driven dashboards can transform organizational strategy and improve cross-departmental collaboration.